Knowing how to create an SEO strategy that grows organic search traffic and drives conversions is an extremely valuable skill to have in 2024.
And one aspect of being a great SEO involves knowing how to track your efforts and manipulate data to inform your content strategy.
But the other crucial aspect of being an SEO is being able to communicate your value to your clients or employer — or even yourself!
This is why managers and marketers love marketing dashboards. It gives them a clear understanding of what marketing initiatives are driving an ROI. So it’s crucial that you know how to create an SEO reporting dashboard that brings visibility to all of your hard work.
In this article, we’ll go over how to create an SEO dashboard and what you should include in it. We’ll also talk about how you should present it to your SEO clients so they’ll be impressed and want to keep working with you.
What is an SEO reporting dashboard?
An SEO reporting dashboard is a tool used to monitor and analyze various SEO metrics for your client’s website. An SEO dashboard’s goal is to provide a visual representation of KPIs (key performance indicators) such as organic growth trends, metrics, and where SEO efforts are driving the most ROI.
A well-designed dashboard will allow you to quickly get a pulse on organic traffic trends and give your clients a way to measure results from the services you are providing. At first, creating a dashboard can seem tricky. But there’s a good chance you spend a lot of time inside Google Search Console, or in an SEO tool like Semrush or Ahrefs.
From an SEO’s perspective, these are enough to get a solid understanding of what’s going on. But just because you’re an SEO expert, doesn’t mean that your clients are. Many times, clients won’t fully understand what the SEO data inside Search Console means. This is why it’s important to create easy-to-understand SEO dashboards based on your search analytics data, so you can paint a better picture of what’s going on with your client’s website.
As an SEO freelancer myself, I’m going to walk you through what you need to track within your dashboard and how to set everything up. Simplicity is key here. So don’t worry, I won’t start coding or anything. I’m just going to show you how to create an effective dashboard that makes the most sense for both you and your clients.
Okay, let’s talk about what you should include in your SEO reporting dashboard.
What should I include in an SEO dashboard?
When creating an SEO reporting dashboard, the level of complexity is really up to you. You can make a simple dashboard in an afternoon that does the trick, or you could spend a week putting together something elaborate. It all depends on the type of website you are working on.
For example, a simple SaaS website with a blog that drives most of the search traffic doesn’t need to be super complex. But if you’re working on a marketplace or a site with lots of UGC (user-generated content), you probably need something more comprehensive.
However, regardless of the type of website you’re working on, there are a few key metrics you should always be tracking.
Here are a few things you should include in your SEO analytics dashboard:
- Organic traffic trends for the overall website
- Organic traffic trends for branded keywords
- Organic traffic trends for non-branded keywords
- Keyword rankings for both branded and non-branded keywords
- Different sub-dashboards for various landing page categories
- Backlinks and domain authority/rating
- Conversions
At the end of the day, the main thing you are looking for is keywords, traffic, and conversions. But sometimes, depending on what data you have access to, you might not even need the conversion part.
Keeping keywords and traffic in mind, you want to split things up between branded and non-branded traffic and keywords. You also want to break this down for different web properties on your site (i.e. blog, homepage, use case landing pages, resources pages, and so on).
It’s very important to get a better understanding of traffic trends from a branded and non-branded perspective. If branded keywords and traffic are growing, it doesn’t necessarily mean that SEO traffic is growing. It could mean that more people are searching for your company name because of some other marketing campaign you did (like running ads) or because word of mouth is growing — which is great!
But, chances are if you’re focused on growing the SEO traffic of a site to help your clients drive more conversions, you’re probably going to focus more on non-branded keywords. So being able to show your clients that your non-branded initiatives are (hopefully) working is key to building confidence with your clients.
Okay, now that we’ve gone over what you should be tracking, let’s create an SEO reporting dashboard and give our clients a way to access it securely and efficiently.
How to create an SEO reporting dashboard (in 6 steps)
Here’s a step-by-step process for creating an SEO reporting dashboard:
- Get access to Google Search Console + Analytics
- Use a Looker Studio template
- Integrate your data
- Create pages for separate web properties
- Customize your template for each client
- Embed your dashboard in a client portal
Okay, let’s dive deeper into each one.
1. Get access to Google Search Console + Analytics
The first step to creating your dashboard is to get access to your client's Google Search Console. This is all you need to get started, but if you want to also show your client where all of their traffic is coming from, outside of just SEO, you also want to ask for Google Analytics access.
Depending on the type of client you work with, they may give you access via your own email or they will create a company email for you and give access to that email — it all depends on the size of the company you are working with.
To get access, ask your client to go into Google Search Console and scroll down and click the “Settings” tab on the right-hand side of the screen.
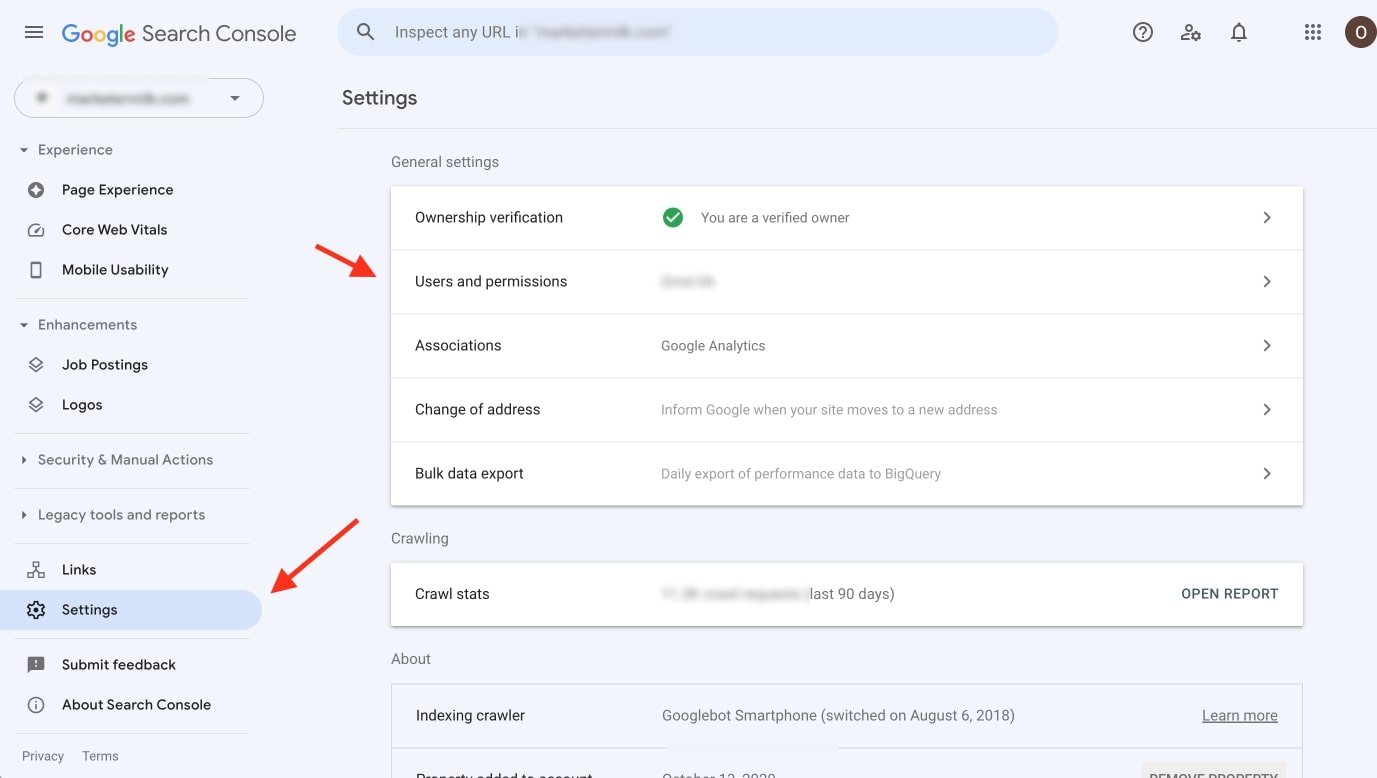
From there, you want to click on “Users and permissions” and then “ADD USER,” and ask to receive full permissions. This will ensure you can pull all the data you need in your SEO dashboard.
Okay, once you have access to GSC, and potentially GA, it’s time to set up your dashboard. There are many paid tools out there that can help you create an SEO dashboard, but the most secure (and free) option, in my opinion, is to use Looker Studio (formerly known as Google Data Studio).
2. Use a Looker Studio template
Once you have access to GSC, head over to Looker Studio and create your first project.
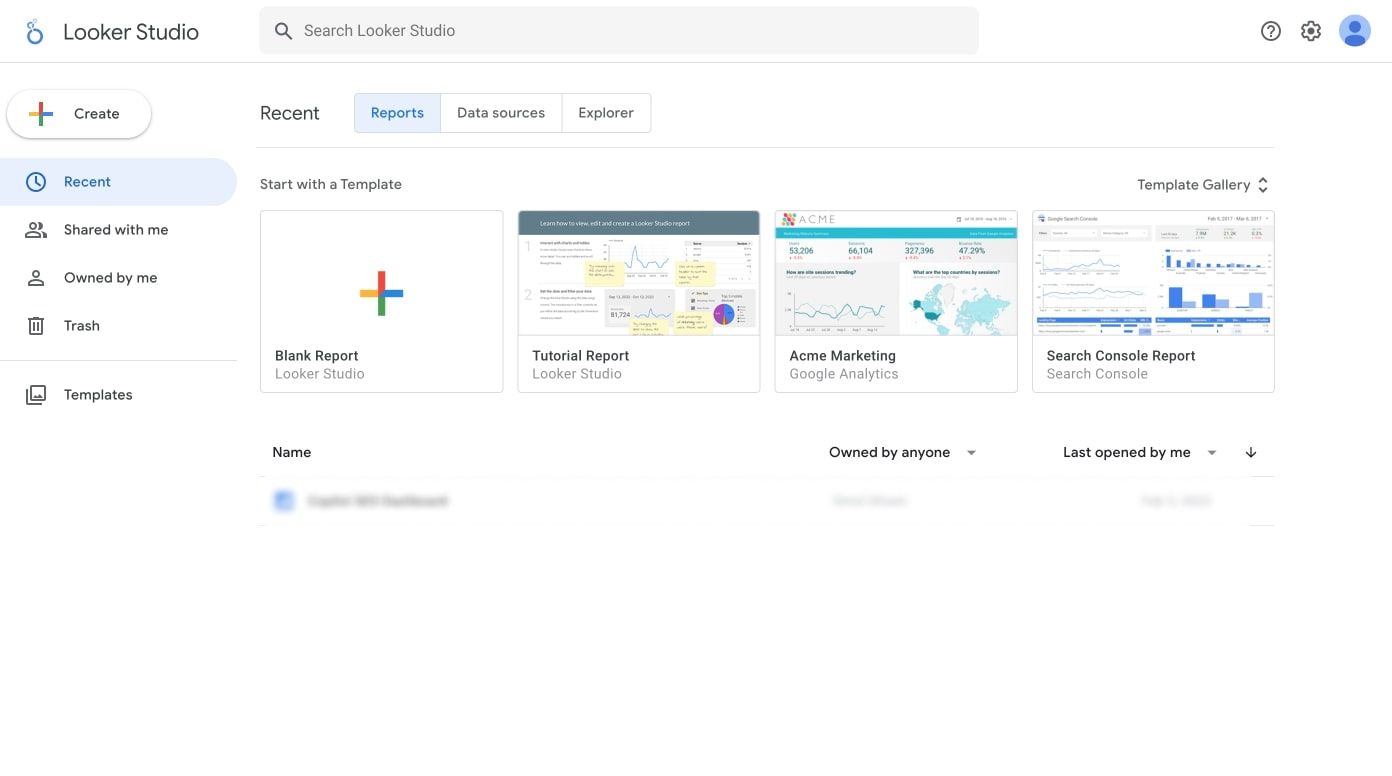
When you open Looker Studio, you’ll notice a few options to choose from. I personally recommend starting with the “Search Console Report” template. I’ll show you how to edit this in a bit. But this acts as a good base for what we need to be tracking.
When you click on the Search Console template, you’ll get a dashboard that is pre-filled with dummy data.
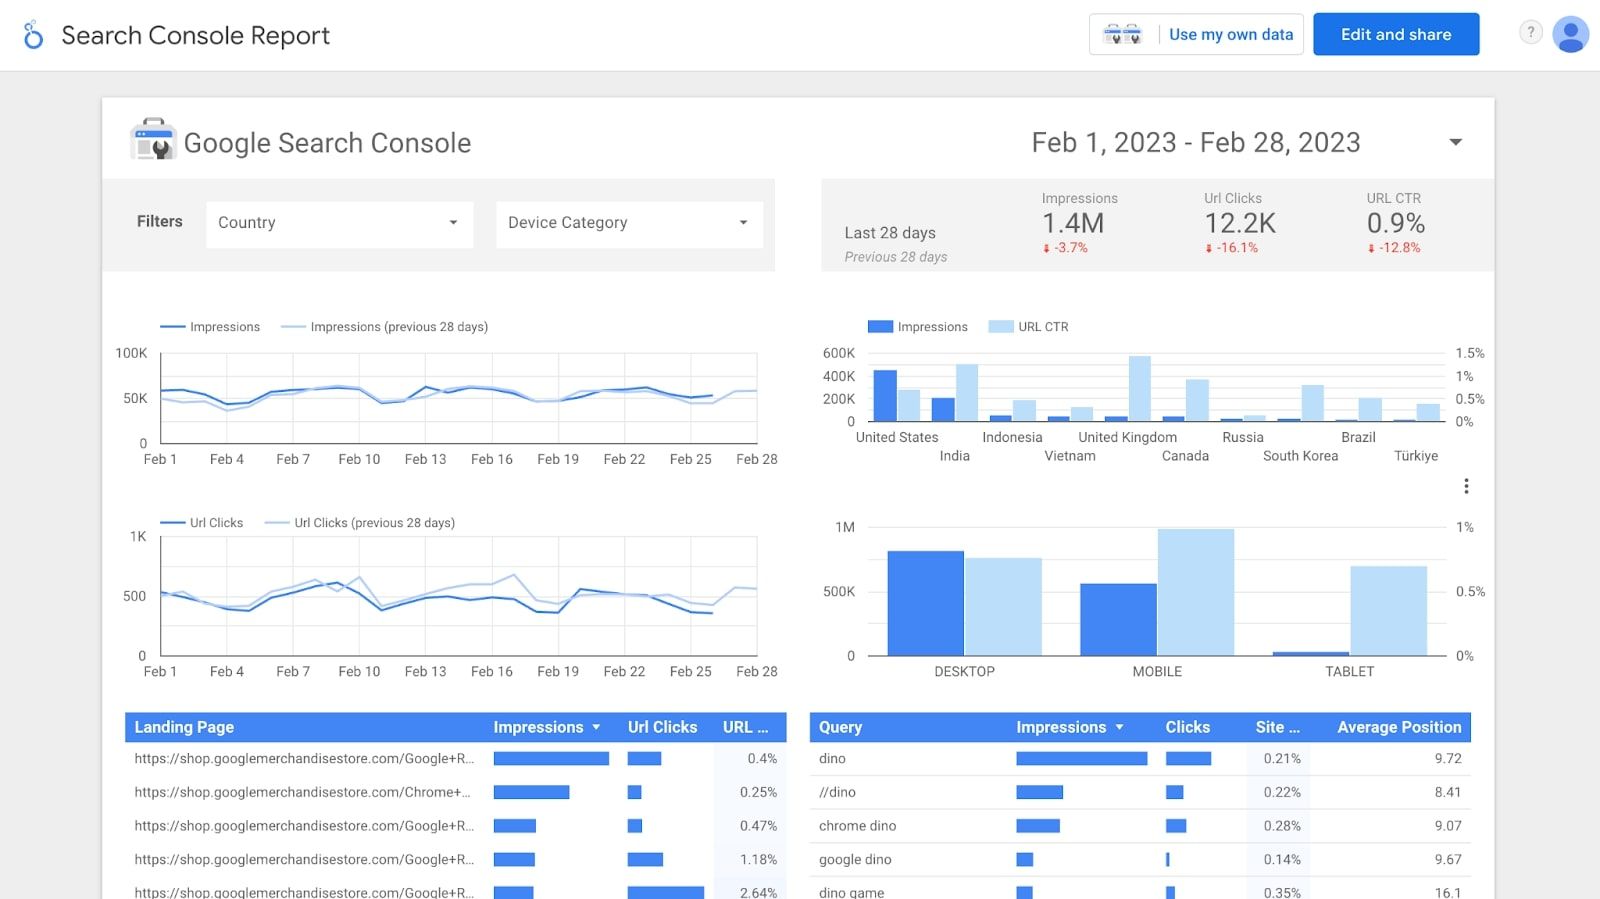
This dashboard shows you (mostly) everything you need — from traffic trends to keywords. However, this is a general overview.
In part four, we’ll go over how to split up your dashboard to get a better understanding of what’s happening on different parts of your website.
But now we need to add our own data to this template.
3. Integrate your data
Once you have your SEO dashboard template set up with placeholder data, it’s time to start replacing each graph with your own GSC data.
To add your own data, click on “Use my own data” in the top right-hand corner. You’ll notice there are two data properties — your site data and your URL data. You’ll want to connect both. Here is what each one is responsible for:
- Site data: Pulls in impression data such as keyword position, CTR metrics, and site impressions
- URL date: Pulls data on landing pages, URL clicks, URL CTR, and impressions
It can be a bit confusing, so make sure you pull both datasets (start with the top option first when you click on “Use my own data.
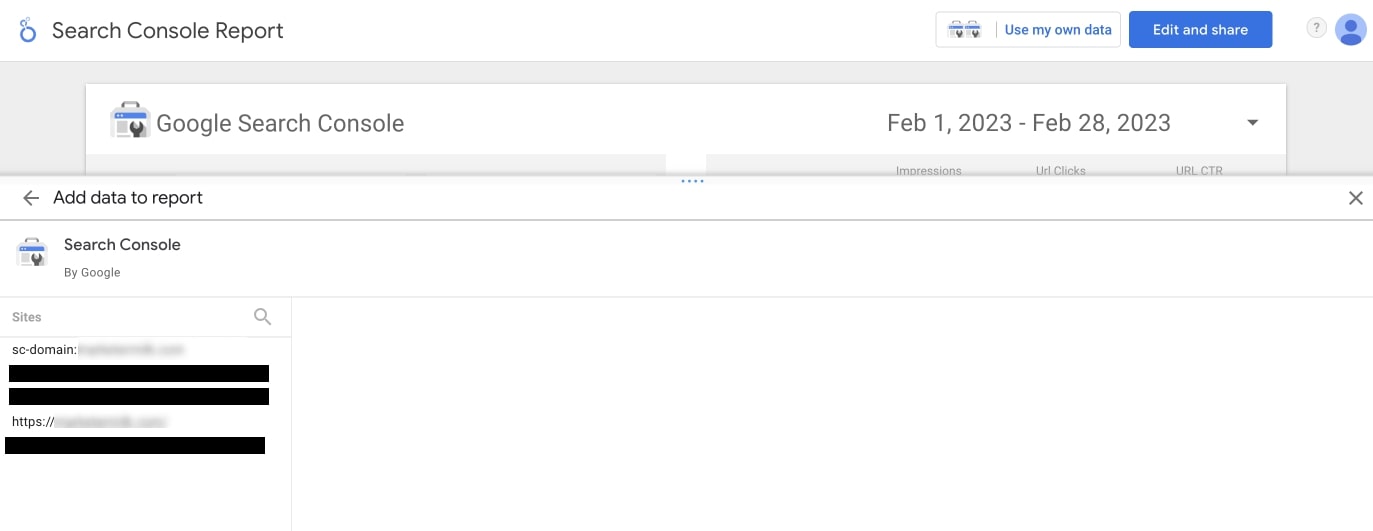
If your GSC account was made a few years ago, you’ll most likely see your website listed twice. And one of those sites might have “sc-domain” listed before. If you see this, use the “sc-domain” version. If you don’t see this option, simply select the option with just your website’s URL.
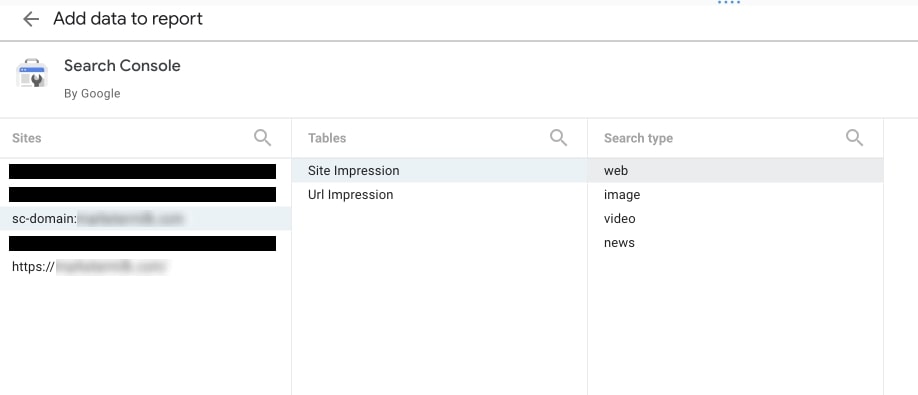
Once you select your URL, click on “Site Impression,” then “Web,” and click “Add” to add this property. When you do this, you should automatically see some of the data in your SEO dashboard populate with your own data. However, there still may be some graphs that did not update.
So now you’ll want to click on “Use my own data” in the top right corner and this time select the bottom option:
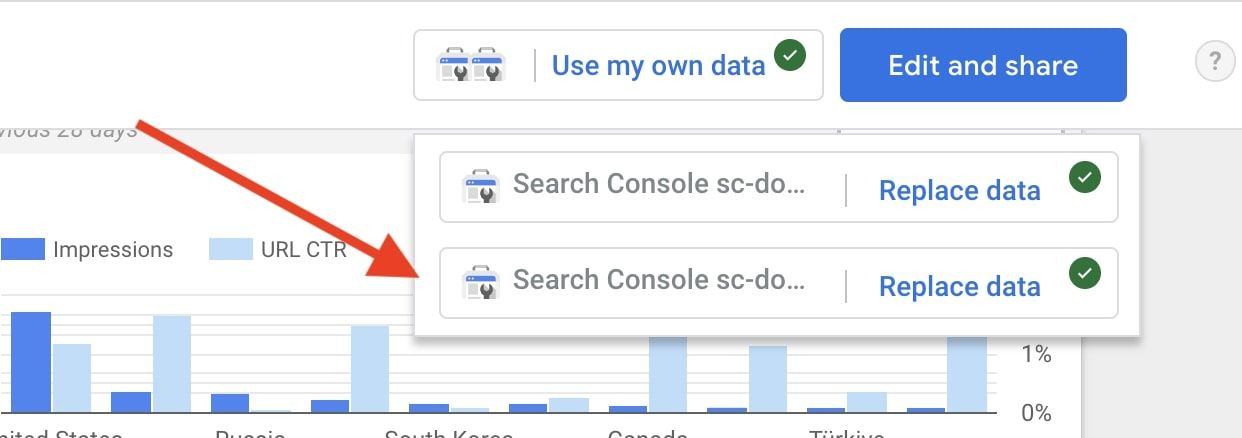
Follow the same step again (in the screenshot before the one above) and click on “URL impression” this time, then select “Web,” and add the property.
Now, you should have your data accurately reflected in your SEO dashboard:
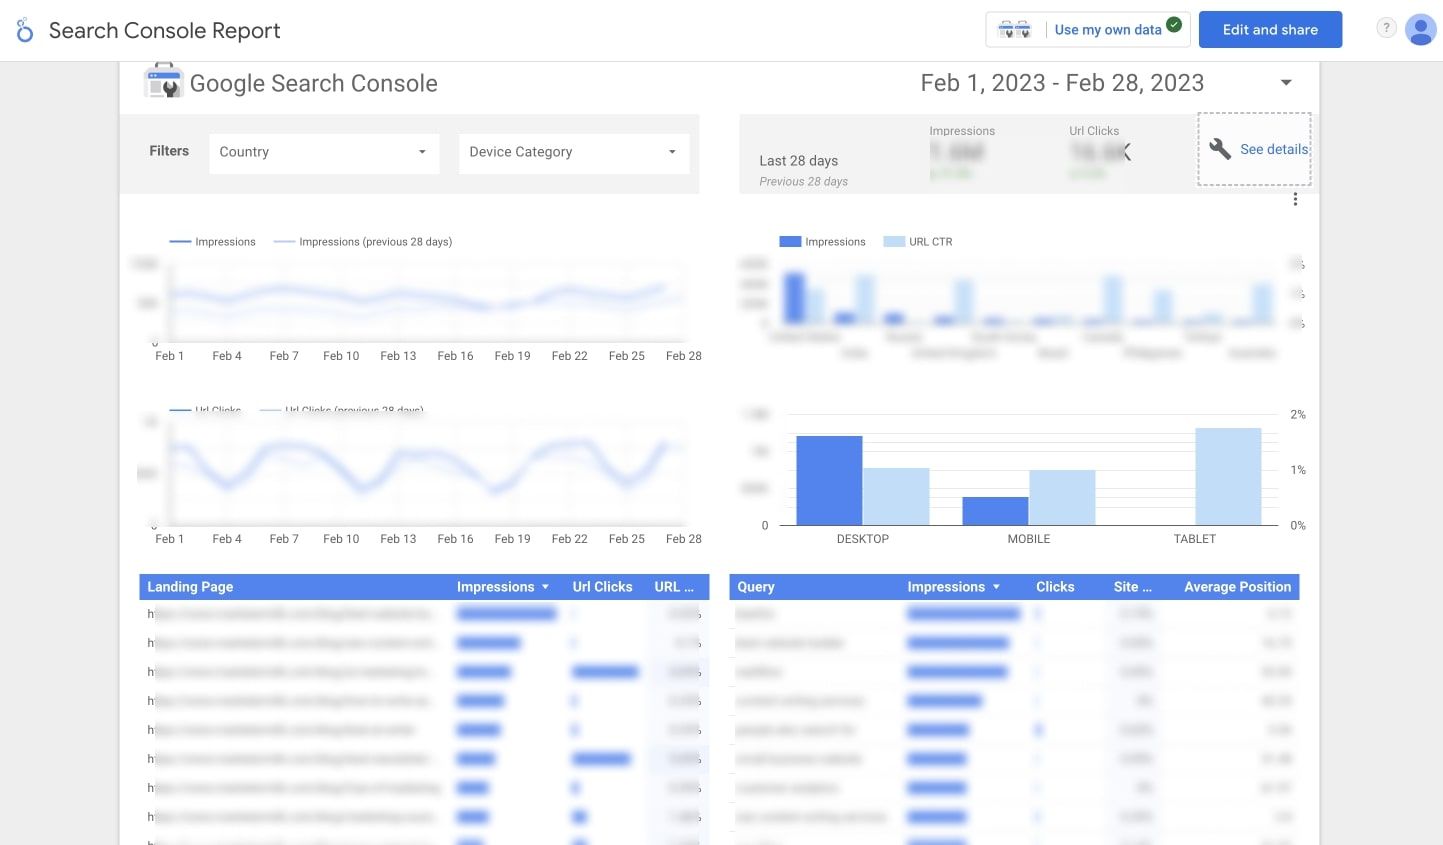
I intentionally blurred out sensitive data, but you get the point.
The one thing to note is that this is a general overview of your entire website and domain. Chances are, you want to split up your dashboard by different properties on your website.
For example, let’s say you want to create an SEO reporting dashboard specifically for your blog. And on top of that, you want to filter by only non-branded keywords and traffic.
Let’s go over how to do that in the next section.
4. Create pages for separate web properties
Now that you have the general overview of your dashboard set up, it’s time to get granular with it and really impress your clients.
As mentioned earlier, I’m going to create a separate SEO dashboard that isolates the blog and non-branded keywords and traffic. To do this, all we need to do is add a new page to our existing dashboard. This process will look the same for every section of your website you want to filter out.
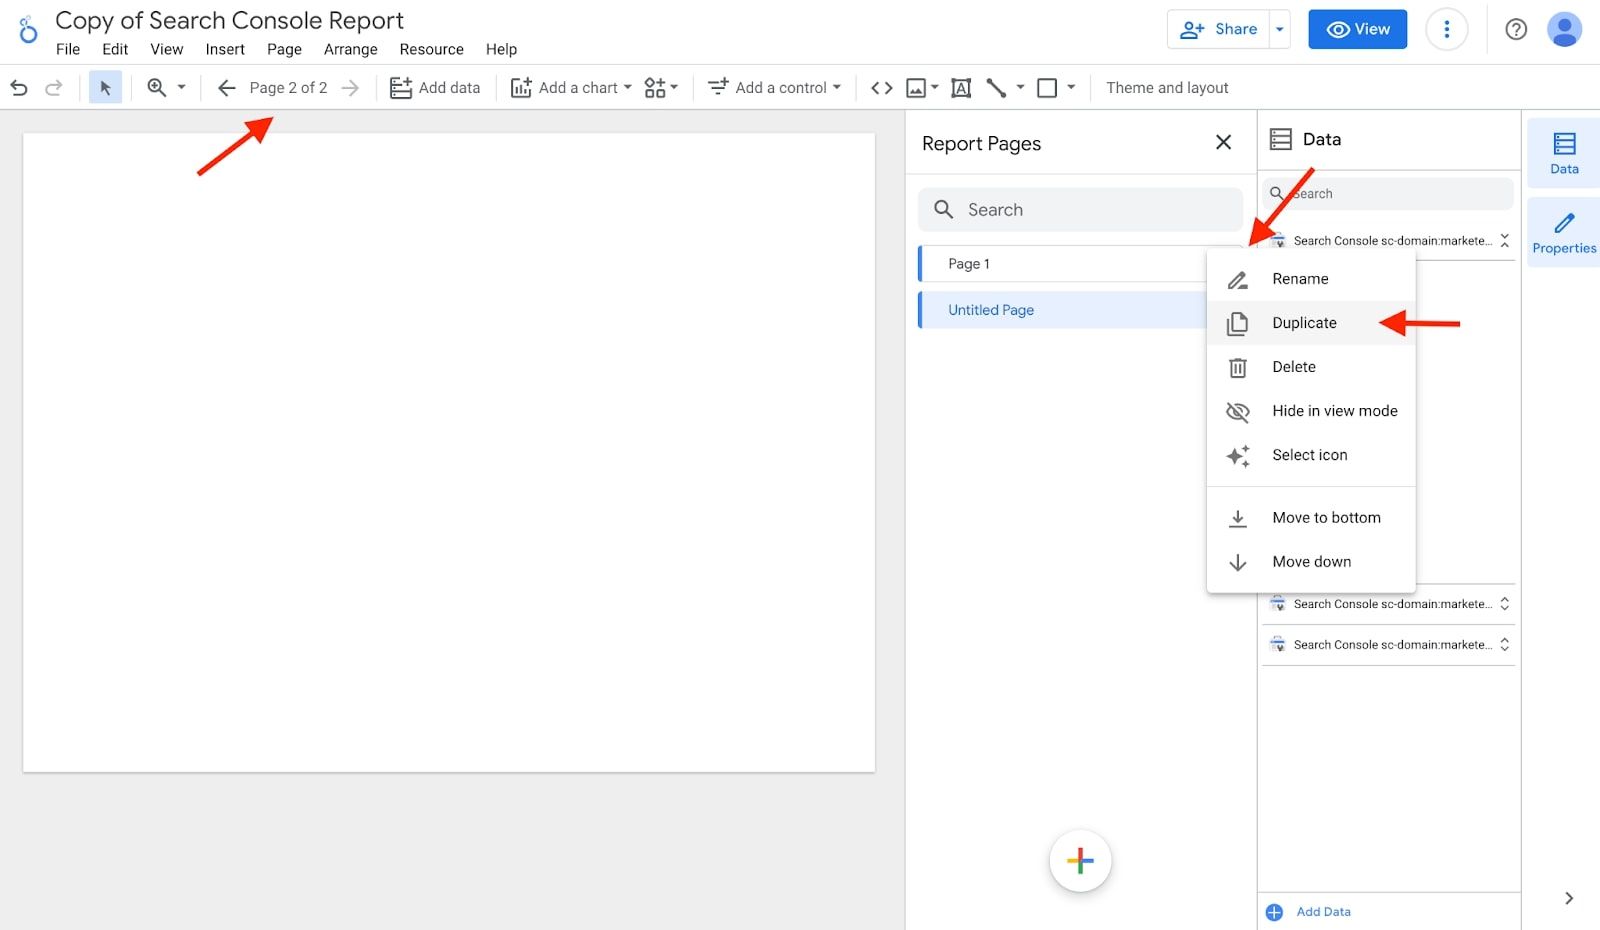
To do this, you’ll want to click on “Edit” in the top right corner of your dashboard. This will give you the ability to create new pages and add filters to your data. Next, you want to click on “Add page” in the toolbar. Once you do this, a new blank page will appear. However, if you want to speed up the process, simply duplicate the first page. You do this by right-clicking on “Page 1” and clicking “Duplicate.”
Now you’ll have a duplicate of your general SEO dashboard. Next, you want to click on each graph, one by one, and start applying your filters. To do this, click on any graph. In this case, I first clicked on the “Landing Page” chart. Once you do this, you’ll see a sidebar on the left that pops out and gives you options to edit the chart.
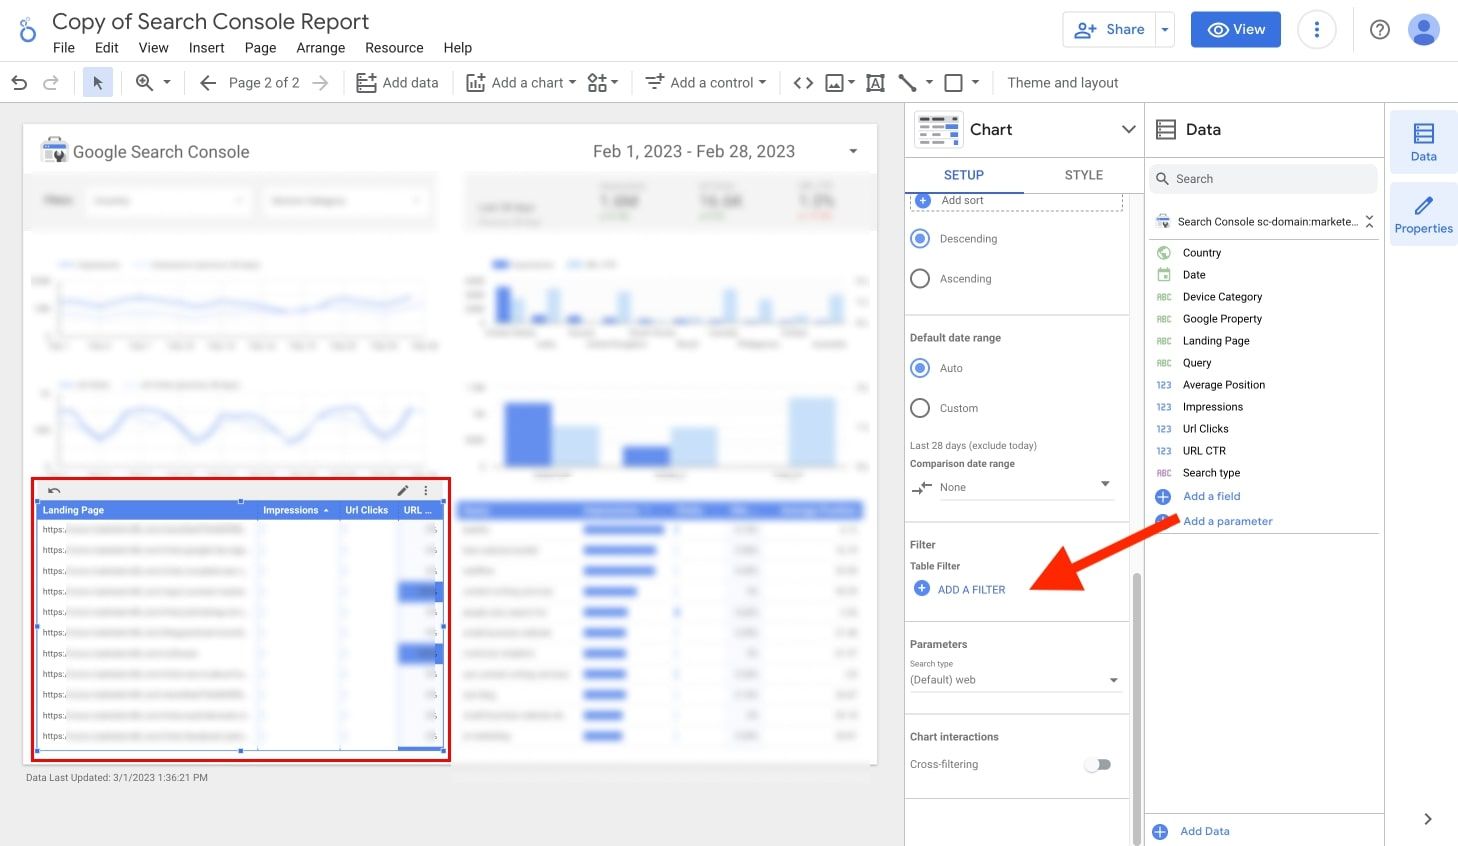
Scroll down to the chart options and click on “ADD A FILTER.” In this case, we want to filter this dashboard by only the blog. So we will apply a landing page filter that contains only URLs with “/blog” in them.

Once you click save, you’ll see your landing page chart only show blog posts. Now, if we wanted to show the top non-brand organic searches, we need to add a new filter on the “Query” section.
Similar to adding the blog filter to the “Landing Pages” chart, click on the “Query” chart and add a filter. This time, we want to exclude our brand terms.
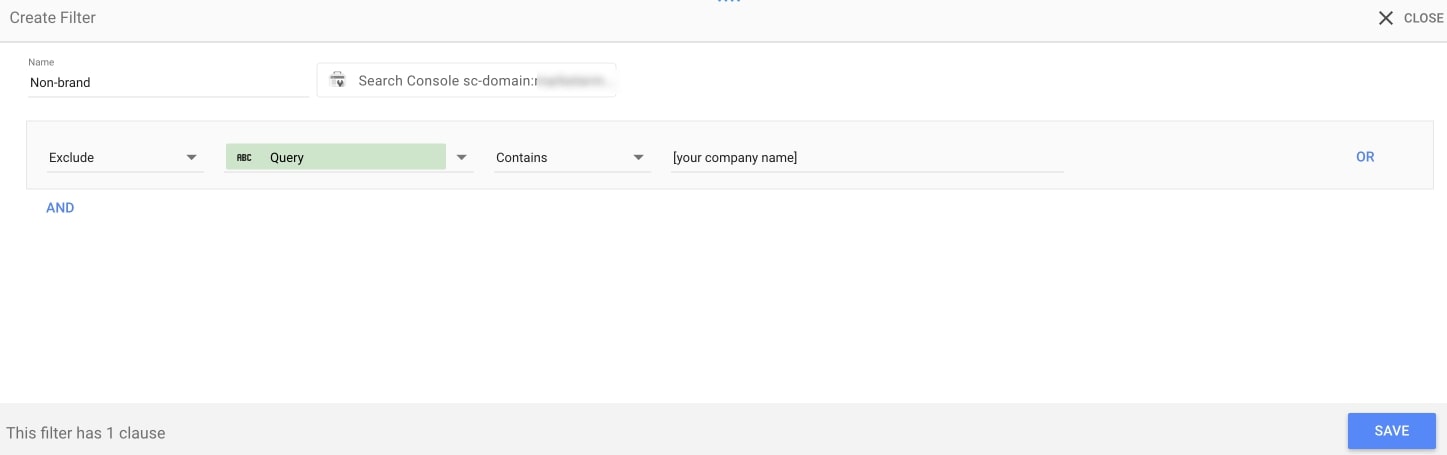
I named this filter “Non-brand” but you can name it whatever you want. If you have multiple variations or spellings of your brand name you’ll want to click on “AND” and add any variations. These will all save under the “Non-brand” filter.
And there you go, now you have two filters — one that only shows the blog and one that only shows non-branded keywords. These filters are saved in your dashboard so you don’t need to keep going through the process of creating the filter for each chart you edit.
To edit the rest of the charts, simply click on them and apply whatever filters you want (you can add multiple at a time).
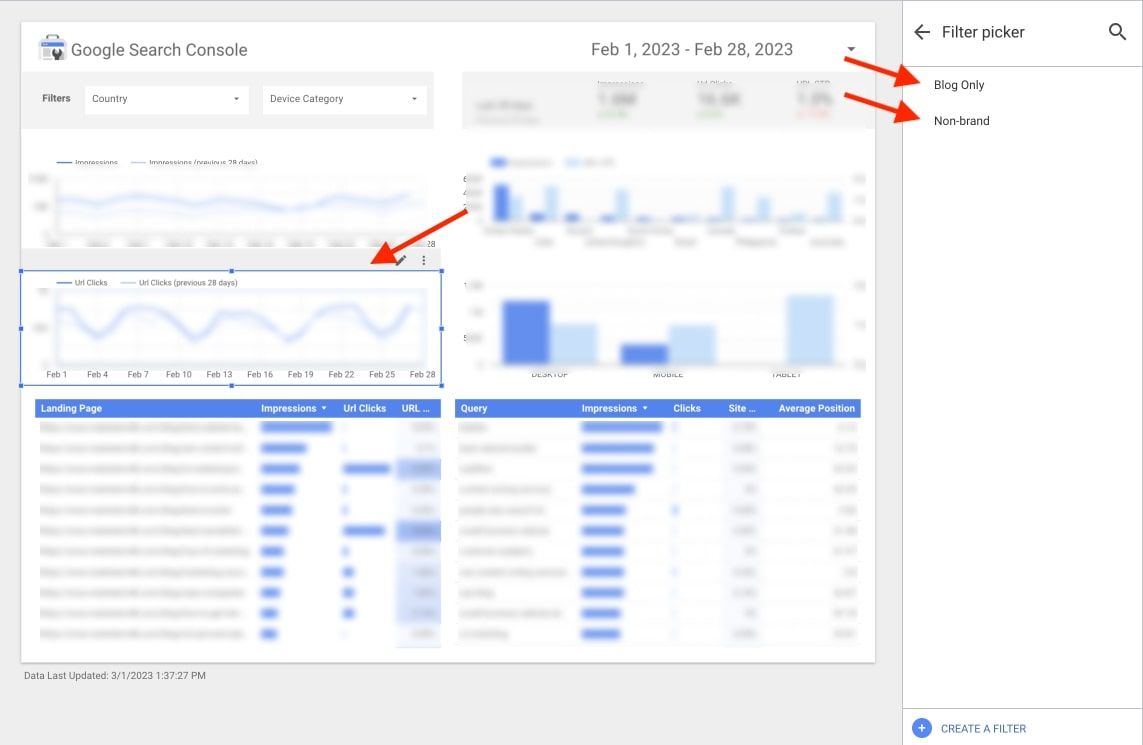
This makes it super easy to keep track of all of your filters. Now, all you have to do is keep repeating the steps above for each chart and page you want to filter your dashboard by.
5. Customize your template for each client
While everything we’ve outlined above does give you the data you need to start tracking your SEO performance, if you want to share your dashboard with a client, it is important to tailor it to their brand.
This is where custom SEO dashboards come into play for both freelancers and marketing agencies.
Similar to other Google products, like Google Slides, you can customize everything from the types of charts you use to the layout of the dashboard, the fonts, logos, and colors. You can do this by clicking on “Theme and layout” and selecting a theme that fits your client's brand.
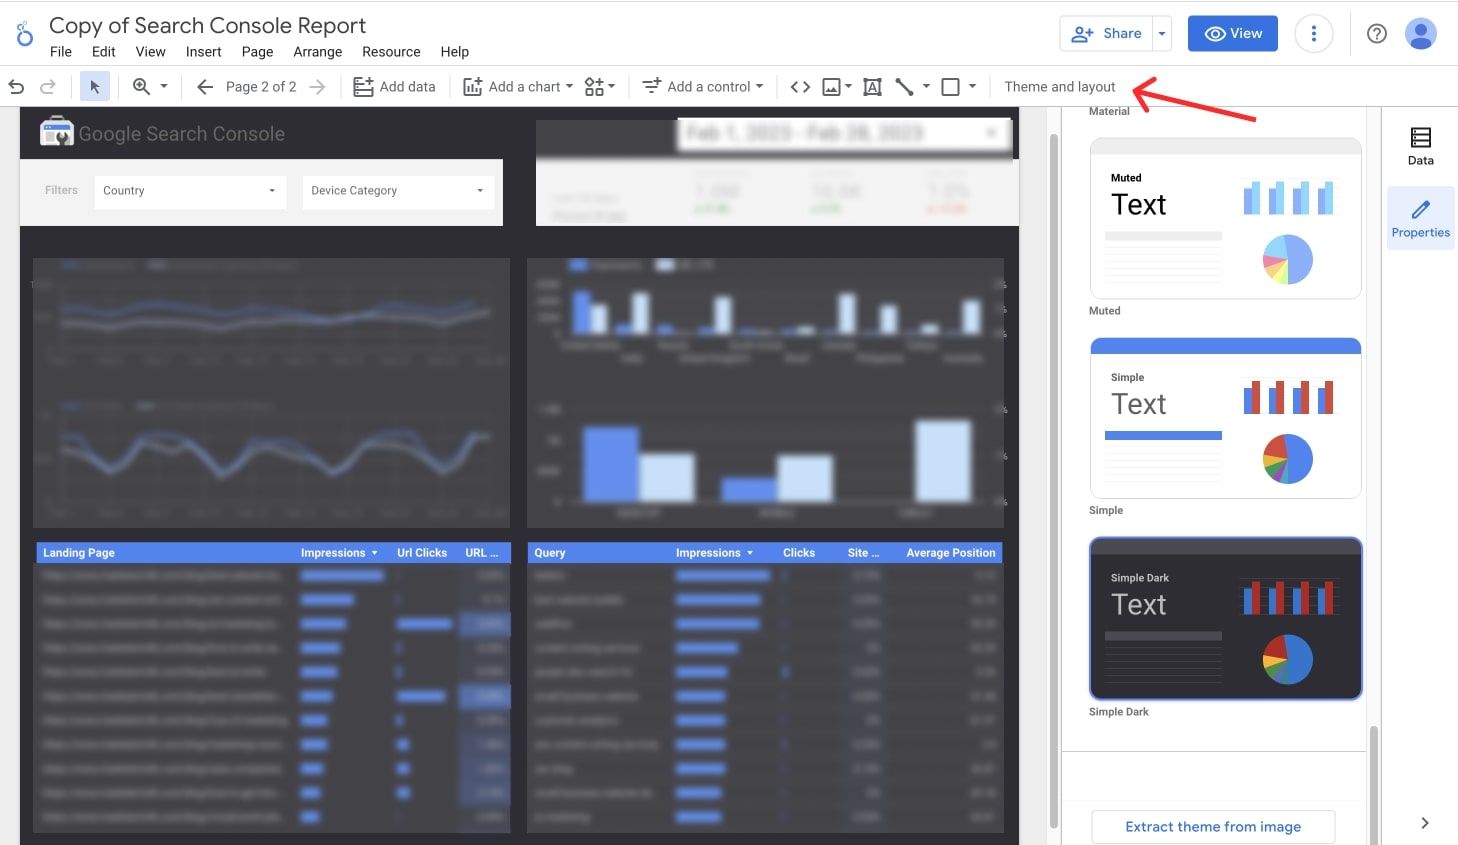
You can also drag in your client's logo in the top left and rename the dashboard to whatever you like. Now, to share your dashboard, you can click on “View” in the top right corner. Here you will also be able to see all of your additional pages (if you’ve created them).
But what if you want to make your dashboard look even more professional and not make it feel like a Google product? This is where our last step comes into play.
6. Embed your dashboard in a client portal
At the end of the day, you want your clients to have a memorable experience working with you. One way you can improve your client experience is to offer your clients a custom, white-labeled client portal.
One tool that I personally use to manage my clients, and create client portals with custom logins that my clients can use, is Copilot. With Copilot, I can integrate all of my existing apps into one place and give my clients a centralized location to handle things like:
- Messaging
- Files and contracts
- Billing, invoices, and subscriptions
- Intake forms
- Helpdesks
But one feature I love most is the fact that I can embed different tools into my client portal and make my agency look like a software business.
In other words, I can embed the dashboard we created above straight into my client’s portal so it looks like a native dashboard. This way, my client can view everything from invoices I send them, project timelines and statuses, and reporting dashboards, without having to bounce around different tools.
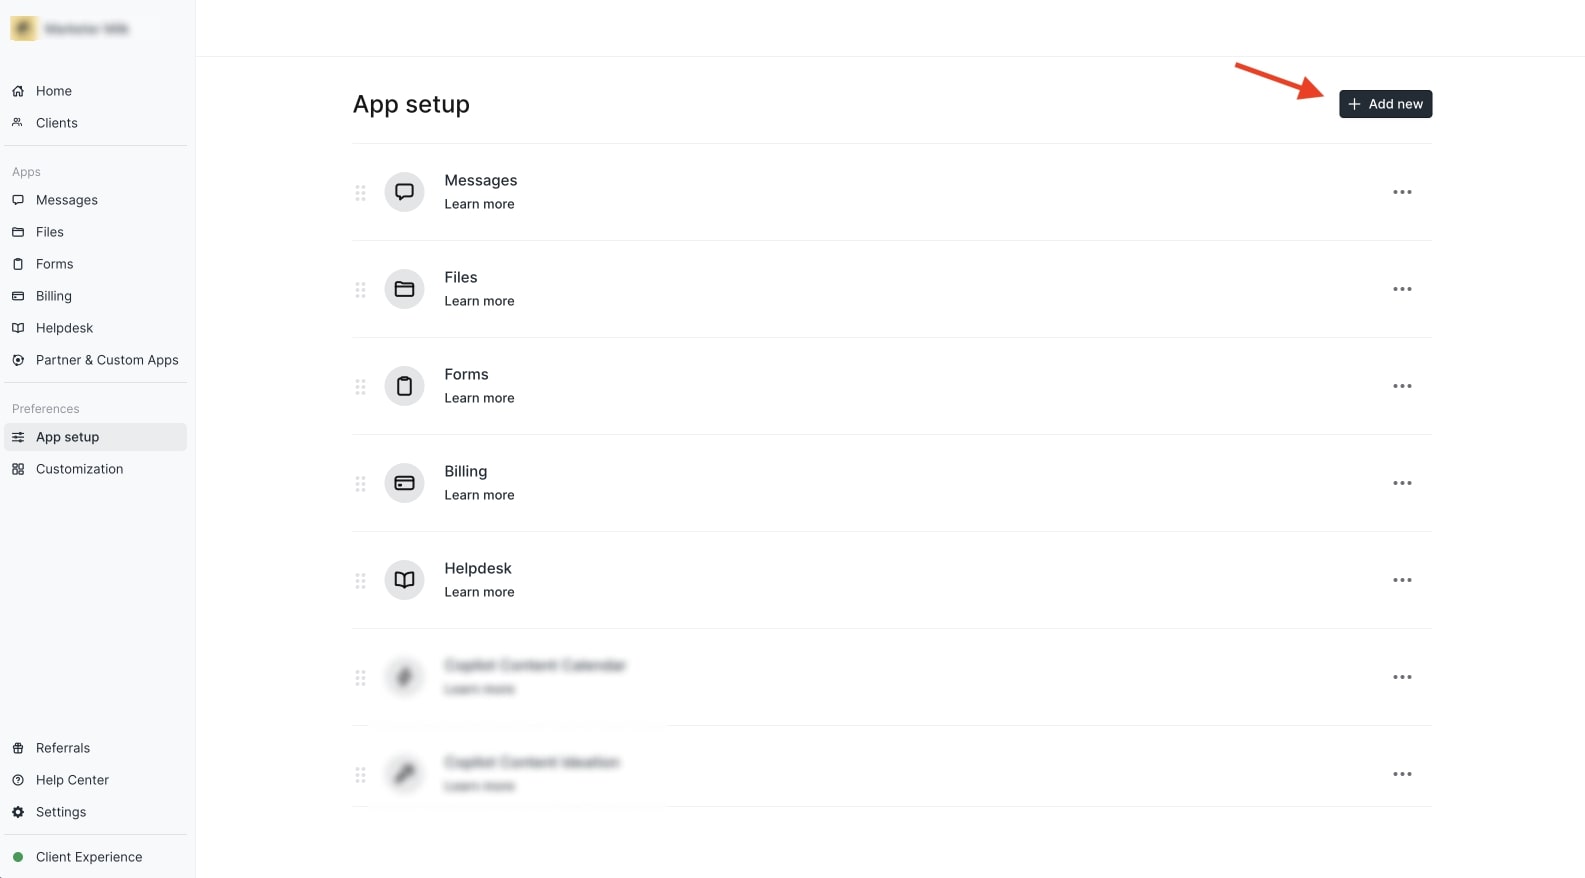
To embed your SEO reporting dashboard into your Copilot client portal, go the the “App setup” section of your portal and click on “Add new.”
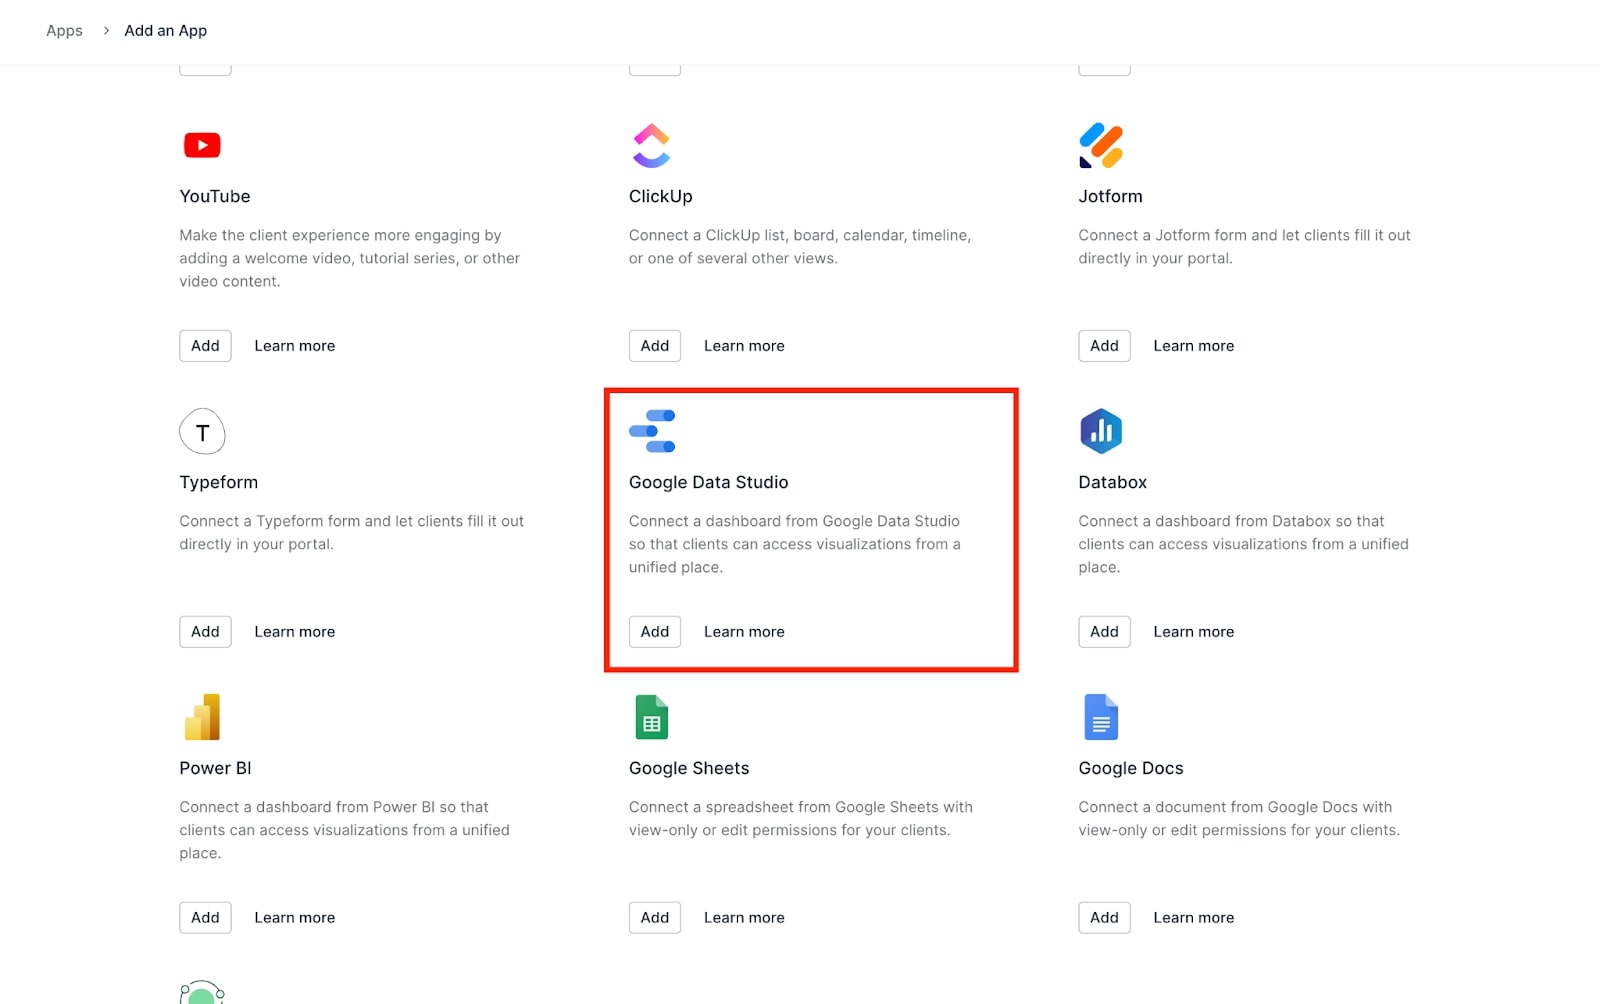
Next, you’ll see a list of apps you can integrate with your portal. Look for “Google Data Studio” and add the app.
Once you add the app, you want to go back to your SEO client dashboard and grab the embed code. We will then paste this embed code straight into Copilot.
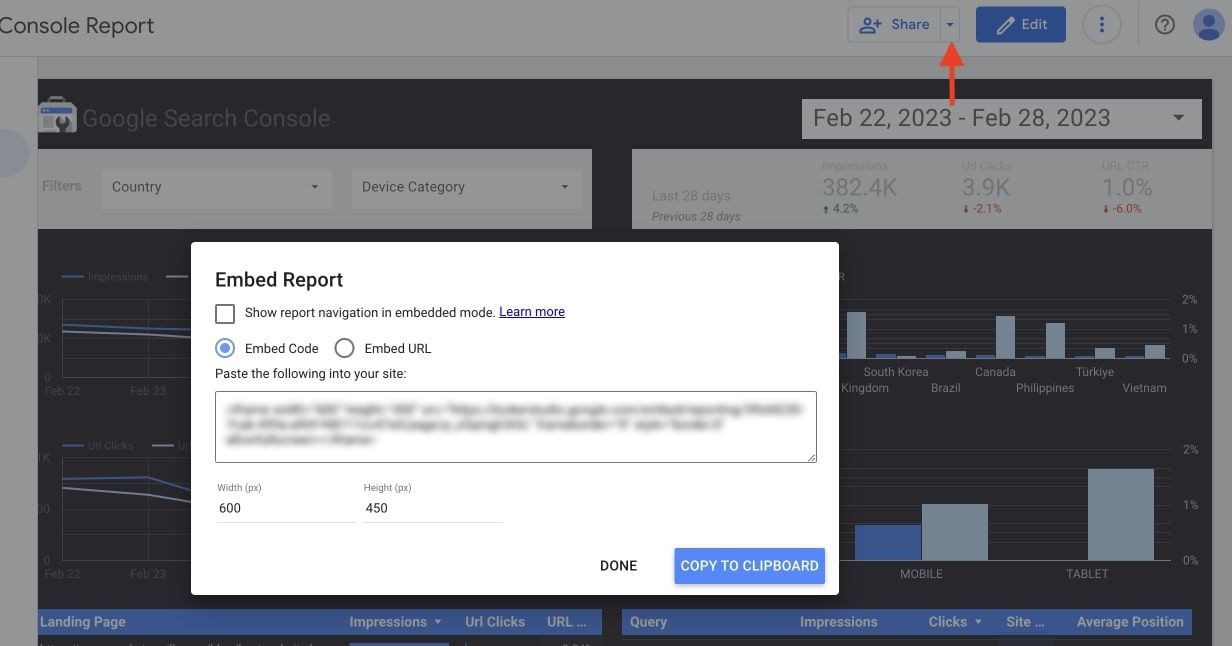
To grab your SEO dashboard embed code, click on the dropdown arrow next to “Share” and select “Emebed report.” You’ll then get a popup with your code. Copy this code and go back to Copilot.
Once you paste the code in Copilot, your client will be able to access their SEO reporting dashboard straight from their own portal.
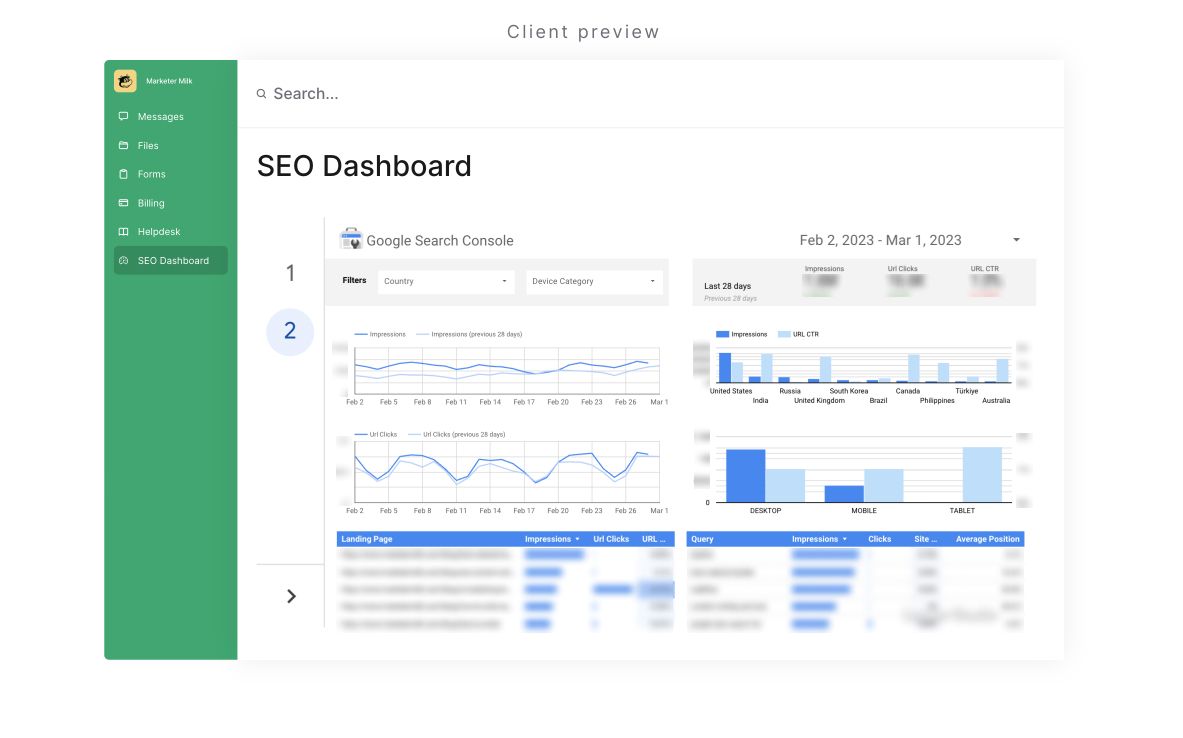
As you can see, your client will now have a tab called “SEO Dashboard,” which is what we named it. And when they click on it, they’ll be able to see all the pages on the reporting dashboard you made.
Now you have clean SEO reporting dashboards that your client can check each time they log in to their client portal.
Keep clients happy with frequent updates
Businesses invest in search engine optimization because they believe it will help them get discovered by people who need their products and services. But SEO can often seem confusing for those who aren’t heavily involved with it.
So, as an SEO, you need to give visibility to your clients on what you’re working on and how it’s affecting the business's bottom line. If you can’t prove the effectiveness of your SEO campaigns, clients are going to have a hard time trusting you and wanting to continue to use your services.
So, from day one, you need to keep your client experience in mind. Providing top-notch services is crucial, but giving frequent updates and adjusting your SEO strategy based on user behavior is how you’ll make your clients trust you.
As mentioned earlier, one of the best ways to improve your client experience, and bring visibility to your work, is through a custom client portal. A client portal will allow your services to feel more like a SaaS (software as a service) product. And with Copilot, you can easily set up monthly subscriptions and productize your services.
If you want to check out Copilot for yourself, be sure to view a demo portal and start playing around with it!
Share this post
Sign up for our newsletter
Subscribe to our newsletter to receive emails about important announcements, product updates, and guides relevant to your industry.
